DC Crime Data Dashboard
GW Data Analytics Boot Camp, 2019
GW Data Analytics Boot Camp, 2019
Jimmy White, Reena Desai, Mario Cosby, and myself built the DC Crime Data Dashboard for our GW Data Analytics Boot Camp final project. This web application allows for the visualization of spatial and temporal trends in five years of violent crime data for Washington, D.C. The application consists of an interactive map for displaying demographic data overlaid with crime by type and D.C. ward, a series of "time wheels" visualizing time-of-day frequencies in crime, a line graph for comparing crime frequencies by month, and an exploration of machine learning and regression techniques to investigate possible explanations of crime patterns. My work on this project focused on back-end data processing, configuring the interactive map, and performing the regression analyses.
On the back-end, the application uses AWS-deployed databases of crime and demographic data. Data processing steps are performed in Python and documented in two Jupyter Notebooks. SQL Alchemy and Flask are used to establish and send data to various endpoints in the application. Starting from a Bootstrap template, the front-end consists of interactive visualizations created with D3, Leaflet, Moment.js, and Chart.js JavaScript libraries. The full application is deployed to Heroku.
The application can be viewed HERE, with the GitHub repo available HERE.
Congressional Cartography Program
Library of Congress, 2015-present
Library of Congress, 2015-present
As a Cartographer in the Congressional Cartography Program, I create maps and perform geospatial analyses for congressional staff looking for spatial insights. Mapping projects range from reference maps of congressional districts to detailed analyses of policy issues and their impacts across local, state, and national scales. Congressional requests and resulting products are confidential to the requesting office, but I can share the below map, showing gender-earnings ratio by congressional district. This map was published in "Gender Pay Inequality: Consequences for Women, Family and the Economy," a 2016 report by the Democratic staff of the Joint Economic Committee of the U.S. Senate.
"A Spatial Vulnerability Assessment of Flooding Risk Based on Environmental and Human Factors in Bangladesh"
Clark University, GIS for International Development, 2015
Clark University, GIS for International Development, 2015
Ting Wu and myself studied the geography of flooding risk in Bangladesh with respect to environmental factors conducive to the natural hazard as well as human factors that strongly influence a hazard's impact on infrastructural damage and loss of life. After collecting and rescaling spatial datasets for a range of factors, we performed a "weighted sum" analysis which produced a composite map of the overall effects of combining each factor's vulnerability patterns. The final results indicate what areas of Bangladesh may be at the greatest relative risk for flooding hazards that could severely devastate local human populations. Understanding the geographies of natural hazard risk from both environmental and human perspectives should be an important consideration for governments and organizations involved in disaster prevention, mitigation, and response.
"Testing a Stepwise Procedure for Land Cover Classification of Heterogeneous Urban Landscapes
Using Worldview-2 and LIDAR Data"
Clark University, Advanced Remote Sensing, 2015
Using Worldview-2 and LIDAR Data"
Clark University, Advanced Remote Sensing, 2015
For my final research project in the "Advanced Remote Sensing" course, I performed a "proof of concept" study which experimented with a land cover classification scheme that relied on a decision tree structure and multiple data types to produce a highly accurate land cover map. Focusing on three locations within Worcester, MA, the study incorporated Worldview-2 imagery, LIDAR data, shapefiles, and orthoimagery. The methodology was generally based on thresholds of the Normalized Difference Vegetation Index (NDVI) to delineate vegetation, LIDAR-derived height calculations to distinguish grass and shrubbery from forest cover, and an automated Classification Tree Analysis (CTA) to specially classify areas in shadow cover in the Worldview-2 imagery. The resulting land cover maps appear to make geographic sense, and a quantitative accuracy assessment based on 3,000 sample points and comparisons to orthoimagery further supports the competence of this methodology. This study contributes to remote sensing research into stepwise classification methodologies and efforts to harness multiple earth-observing data types in the production of highly-accurate land cover maps.
"A Modern, Accessible Web Mapping Application For Clark University"
Clark University, Web Mapping and Open Source GIS, 2014
Clark University, Web Mapping and Open Source GIS, 2014
The objective of this course project was to use the Google Maps API and HTML scripting to develop an interactive web map for Clark University. Along with Jiayue Li, Melat Seyoum, and Shane D'Lima, we produced a functional web map application with a customized map palette (using HTML/CSS) and categorized GIS layers managed in Google Fusion Tables. Through our considerations of functionality and design, this project allowed me to better understand project methodologies and technical requirements associated with web development.
The full interactive map can be explored HERE.
The full interactive map can be explored HERE.
"Racial and Socioeconomic Equity in Urban Park Access: A Geostatistical Analysis of Philadelphia"
Clark University, Intermediate Quantitative Methods in Geography, 2014-2015
Clark University, Intermediate Quantitative Methods in Geography, 2014-2015
For my final research project for my Intermediate Quantitative Methods in Geography course, I examined urban park access in Philadelphia and used spatial and non-spatial statistical methods to examine possible relationships between block group-level socioeconomic conditions and inequalities in park access. My objective was to test a finding that has been observed in other environmental justice research: that neighborhoods with more racial minorities and conditions of poverty have more limited access to park space than more affluent, racially white neighborhoods. Borrowing from park access insights gained from my Summer of Maps fellowship with Azavea, I created street network-sensitive measure for park proximity and compared proximity values with Census data using linear regression, cluster analysis, and Local Moran's I (LISA) techniques. Although the non-spatial statistical methods proved largely inconclusive, the Local Moran's I analysis identified localized areas within Philadelphia that appear to be experiencing limited park access as well as disadvantageous socioeconomic conditions. In Spring 2015, I expanded my analysis to include the census tract geography level and data from 1960 to 2010. I presented the results of this expanded study at the Association of American Geographers Annual Meeting in Chicago on April 21, 2015.
"DataHaven"
Azavea, Summer of Maps program, 2014
Azavea, Summer of Maps program, 2014
As part of my fellowship with Azavea's Summer of Maps program, I worked with DataHaven, a New Haven, Connecticut-based non-profit working to compile, analyze, and share public data related to community well-being in order to improve local policymaking and educate the public. Incorporating data on local crime as well as potential risk factors for crime such as bus stops and vacant homes, I used risk terrain modeling software and GIS analyses to map and analyze patterns of crime risk in New Haven. In addition to visualizing risk terrains by crime type and population density, I mapped local survey responses to gauge links between crime risk and public perceptions of neighborhood social capital and safety. My work with DataHaven also included a separate analysis of recent historical trends among foreign-born immigrant communities in Connecticut.
"Community Design Collaborative"
Azavea, Summer of Maps program, 2014
Azavea, Summer of Maps program, 2014
As part of my fellowship with Azavea's Summer of Maps program, I worked with the Community Design Collaborative to perform a suitability analysis of Philadelphia to determine parts of the city that would be strong candidates for park revitalization grants. The Community Design Collaborative, a Philadelphia-based non-profit that provides pro bono architecture and design consulting services to low- and moderate-income communities, was interested in determining candidacy based on a range of socioeconomic and built-environment variables, including family poverty, youth population, and impervious surface coverage. My work on the project included data collection, data management, and spatial analysis, culminating in a comprehensive report on the geography of grant candidacy in Philadelphia and in-depth profiles of top candidate sites.
"Shannon Community Safety Initiative"
Clark University, Massachusetts state grant program, 2013 - 2015
Clark University, Massachusetts state grant program, 2013 - 2015
Between 2013 and 2015, I served as a research assistant for the Clark University research team of the Shannon Community Safety Initiative (SCSI). The SCSI is a Massachusetts state grant program aimed at supporting multidisciplinary approaches to combating gang and youth violence through intervention, prevention, suppression, and community involvement techniques. The research team at Clark University serves as a Statewide Research Partner for the SCSI and is led by Laurie Ross, Ph.D., and Ellen Foley, Ph.D. My contributions to the project included community resource mapping, hot spot analysis of crime activity, and the mapping of demographic and socioeconomic variables in Worcester. In addition to GIS-related analysis, I also extensively reviewed research on the use of social network analysis (SNA) to understand informal criminal networks and social connections of youth through crime data.
"Spatial Analysis of Housing Vacancy and Crime Rates in Baltimore, Maryland"
Clark University, Social Applications of GIS, 2014
Clark University, Social Applications of GIS, 2014
This project applied methods of spatial analysis to test one of the most well-known theories of renown urban thinker Jane Jacobs: the importance of "eyes on the street". Jacobs argued that a well-populated city streetscape deters crime and helps to maintain the social order through the attention and vigilance of pedestrians and residents, while a heavily deserted street is apt to be unsafe and more crime-ridden. To apply statistical rigor to this idea, Faleh Aldham and myself used linear regression and Local Moran's I (LISA) analyses to study the relationship between housing vacancies and crime patterns in dense residential neighborhoods in Baltimore. While a multitude of factors are undoubtedly associated with crime prevalence, our findings showed a positive, moderate relationship between high vacancy rates (fewer "eyes on the street") and high crime rates.
"Analyzing Youth Arrest Patterns in Worcester, MA Using Spatial Statistics: 2009-2012"
Clark University, Advanced Vector GIS, 2013
Clark University, Advanced Vector GIS, 2013
Working alongside Michelle Andrews (Clark University B.A. Geography, 2014), our final course project in Advanced Vector GIS focused on mapping patterns of youth crime in Worcester, MA. The core aim of the project was to study arrest patterns using spatial statistics. We implemented hot spot and cluster analyses using Local Moran's I (LISA) and Nearest Neighbor Hierarchical Clustering in ArcGIS, GeoDa, and CrimeStat to determine statistically rigorous concentrations and hot spots of youth arrests. Our research identified neighborhoods-of-concern in Worcester that are experiencing severe and persistent problems with youth crime activity.
"Urban Expansion Detection and Analysis Comparing Three Cities in China"
Clark University, Introduction to Remote Sensing, 2013
Clark University, Introduction to Remote Sensing, 2013
In my first semester at Clark University, I was able to further my knowledge of remote sensing techniques and applications. For our final class project, Faleh Aldham, Jiabin Heng, Holly Zanoni, and myself used supervised image classification methods in IDRISI to map and quantify the expansion of three rapidly growing Chinese cities. We then used our area calculations and economic data to try to find statistical evidence of the Chinese housing boom (ie. urban land growth disproportionate to population and economic growth). While our research methods proved inconclusive in detecting mass vacancies in urban land, the project was educational in exploring the applications of remote sensing to urban studies as well as the issues associated with rapid urbanization and human development.
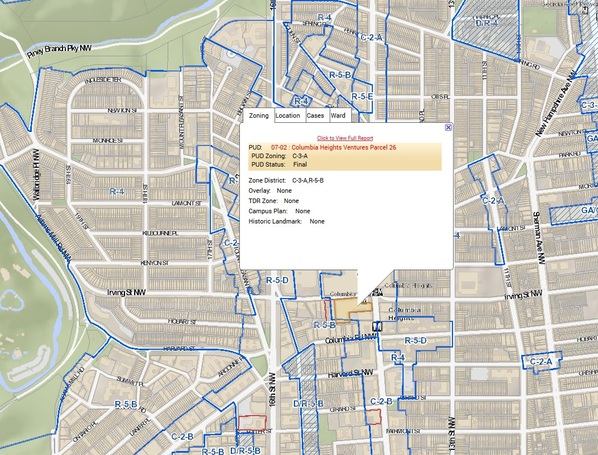
"DC Zoning Map"
District of Columbia Office of Zoning, 2012 - 2013
District of Columbia Office of Zoning, 2012 - 2013
sThe DC Zoning Map is an interactive online map application that provides the public with comprehensive zoning data. My core responsibilities as Zoning Data Coordinator at the D.C. Office of Zoning involved making updates to zoning data in ArcGIS, addressing functionality issues, and managing the overall accuracy and functionality of GIS-based zoning data and the Zoning Map application itself. In my time at the Office of Zoning, I successfully implemented new data layers into the application, diagnosed errors and glitches affecting the map, and worked with members of the public to answer questions and provide project support related to data in the map.
To view the DC Zoning Map application, click here.
To view the DC Zoning Map application, click here.
"Natural Hazard Risk in Haiti"
University of Mary Washington and Library of Congress, GIS Capstone Project, 2010
University of Mary Washington and Library of Congress, GIS Capstone Project, 2010
For my GIS Capstone Project at UMW, I studied the physical and human geographies of Haiti in order to map levels of risk across the country for natural hazards such as earthquakes, hurricanes, floods, and landslides. This project grew out of cartography work I was engaged in during an internship with the Geography and Map Division of the Library of Congress. I used physical geography concepts and ArcGIS tools in raster analysis and cartography to map slope steepness, land cover classifications, and storm and flood records that illustrated degrees of vulnerability to natural hazards across the country.
"Demographic and Crime Conditions Near Public Housing in Washington, D.C."
University of Mary Washington, Applications of GIS, 2009
University of Mary Washington, Applications of GIS, 2009
My final project in "Applications of GIS" at UMW studied crime patterns in Washington, D.C. in relation to demographics and public housing complexes. I applied ArcGIS tools to quantify and map crime incidents and demographic data corresponding to the immediate neighborhoods of public housing units. The study's hypotheses that public housing complexes were concentrated in racially "majority minority" and crime-ridden neighborhoods were supported by the results of the research. This project was very educational for me in that it allowed me to discover GIS techniques and principles that can be applied to urban issues such as crime, poverty, and racial segregation.
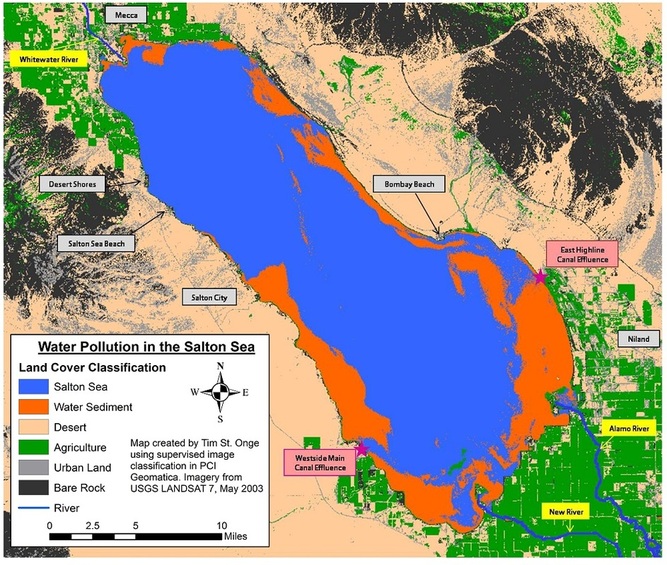
"The Geography of Water Pollution in the Salton Sea"
University of Mary Washington, Introduction to Remote Sensing and Air Photo Interpretation, 2009
University of Mary Washington, Introduction to Remote Sensing and Air Photo Interpretation, 2009
In 2009 I gained exposure to remote sensing technologies and techniques in air photo interpretation. For the final class project demonstrating our introductory skills to the field, I studied water pollution in California's Salton Sea. The Salton Sea is a saline lake in southern California that has no primary outflows, making it subject to heavy pollution from agricultural runoff and polluted rivers that flow into the lake. I used satellite imagery of the lake to conduct supervised image classifications in PCI Geomatica that identified portions of the lake that were experiencing high levels of pollution sediments. I was able to present this work as an Illustrated Poster Presentation at the 2010 Association of American Geographers Conference in Washington, D.C.